A function is a relation in which every input value (every member of the domain) maps to one and only one (OAOO) output value (member of the range).
We can represent functions in a number of ways - here a few of these ways:
- As a set of ordered pairs: {(1, 1), (2, 2), (3, 3), (4,4)}

- As a rule: y = 4x + 1
- When we have a function rule, the x value above is the independent variable; we are free to independently choose its value and it is not dependent on the value of anything else (other than possible limits on the domain, such as only looking at positive numbers)
- The y value represents the dependent variable; it is dependent on the value of the input.

It does not really matter which way you express the function, they all mean the same thing. The most visual way to represent a function is by graphing it.
It is important to be able to recognize when a relation is a function. According to our definition, every input value must have one and only one (OAOO) output value.
Therefore, the following are relations, but NOT functions:
- {(1, 4), (2, 7), (5, 10), (2, 5)}
- This relation is not a function because the input value 2 has more than one possible output (7 or 5).

- This relation is not a function because the input value 4 has more than one possible output (4 or 3)

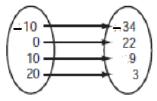
- This relation is not a function because the input value -10 has more than one possible outcome (-34, 22)
- x = y2
- This relation is not a function because when it is graphed we will have more than one output value for almost all x values (this looks like a parabola laying on its side - see the graph below)

- This relation is not a function because we have many x values with more than one y value (this is a graph of the example above, x = y2). To determine whether a relation is not a function, you need to find at least one instance where an x value has more than one y value; one way to do this with a graph is by using a "vertical line test." If you were to lay a vertical (up and down) line across this graph, would the graph touch the vertical line in more than one place? In this case, it would. You can use a pencil as your vertical line tool. If you slide it across the graph, you will see it crossing the graph in more than one place.
In Algebra 1, we study different function families; these are functions based on polynomials of a certain degree.
Some function families studied in Algebra 1 include:
We also can use function notation (f(x) notation) when referring to functions.
These class notes provide further explanation and examples about functions.
These are other class notes on the topic.
Comments (0)
You don't have permission to comment on this page.